Tableau Behind The Scenes
Date
Jan 28, 2022
Category
Tableau Tips

Tableau is an incredible tool that empowers everyone to see and understand their data. And this can be done in seconds, with its distinguishing drag and drop feature, which allows to quickly discover trends and outliers.
And even if you have been using Tableau for quite some time, it is still not quite obvious what exactly is happening when we start playing with our data.
In this article, I will try to explain Tableau’s behind the scenes with 4 practical examples and, more importantly, how to apply these concepts to bring your Tableau skills to the next level.
So, what happens behind the scenes?
Essentially, Tableau is a SQL interface which means that when we open its blank canvas and start dragging and dropping dimensions and measures into the view, Tableau in the background is writing queries for us to pull the data and deliver our desired analysis.
The way to better understand this concept is by using a tool called Tableau Log Viewer (TLV), which provides a real-time view of the queries that are automatically generated by Tableau while we build our charts. In case you are interested in trying it out yourself, TLV is a free tool, available to download here. Also, if you are curious about other powerful and hidden Tableau features, check out my other article below and let me know what else I should add to the list.
10 Secret Tableau Features You Should Start Using Right Away towardsdatascience.com
1. Columns and Rows
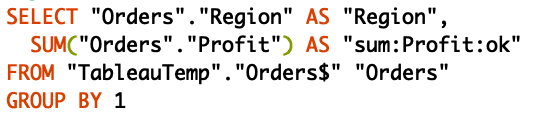
Let’s start with a very simple example. I’m connecting to the Superstore table and I’m just going to take the ‘Region’ dimension and drop it into the columns. As you can see, as I did that, Tableau automatically generated a statement that puts the ‘Region’ field both in the SELECT and GROUP BY clause:
Now, let’s see what happens if we add a measure to the view. As soon as I add ‘Profit’ into the rows, the blue pill appears as part of the SELECT statement.

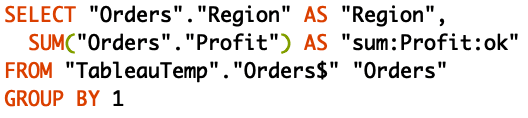
Why is this useful? Well, if you struggled to understand the difference between blue pills and green pills, you now understand how Tableau uses them differently. Indeed, when we use blue pills or dimensions (‘Region’) and green pills or measures (‘Profit’) in a view, the former will appear in the SELECT and GROUP BY statement and the latter will appear only in the SELECT statement.
2. Filters
Let’s do another example. I’m now going to take ‘Market’, put it on the filter shelf and then filter by the ‘EMEA’ market. In the logger, I can immediately see that ‘Market’ becomes part of the WHERE clause.

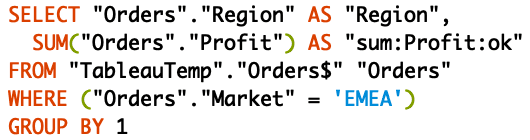
Why is it important? Well, pretty much everything that goes into the WHERE clause can actually be optimised. Your database will process the query faster by indexing the columns that go into the WHERE clause, hence why in this case we might think of doing that for the ‘Market’ column.
3. Simple and Table Calculations
Let’s now see what happens when we use calculations. I have one prepared already which is ‘Cost’, and it is calculated as ‘Sales’ – ‘Profit’. As you can see below, this calculation is actually pushed and performed by the database and Tableau just gets the result back and visualises it in the front end.
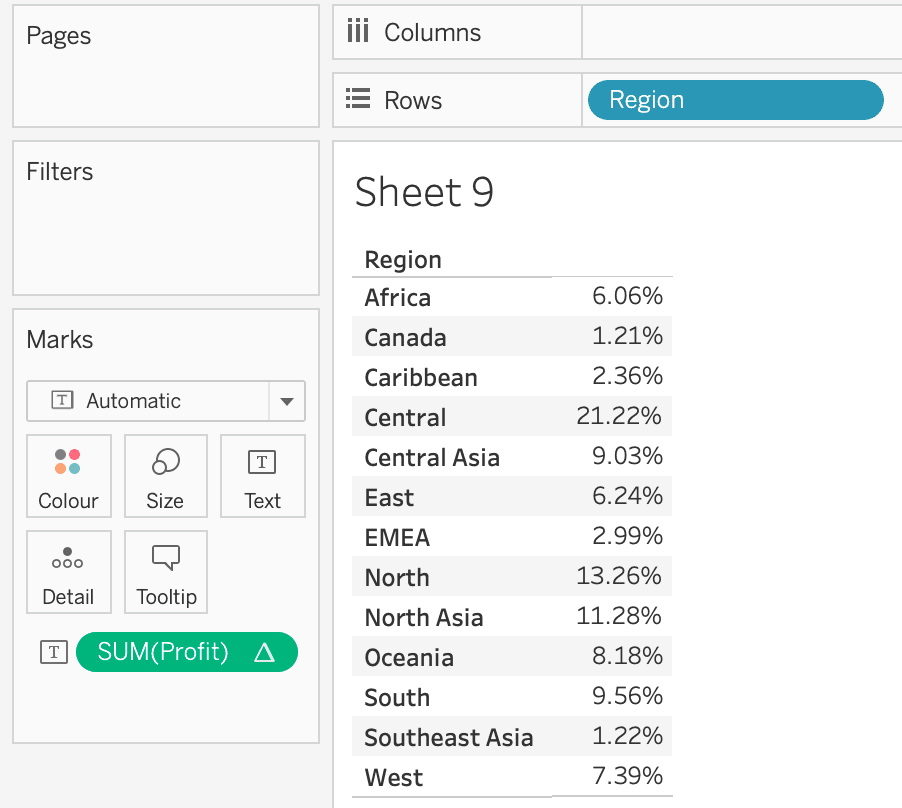
Table calculations are treated differently by Tableau. In this case, I’m looking at the ‘Percentage of Profit’ generated in different ‘Regions’. This is actually performed in Tableau since if we look at the actual query below, there is nothing mentioned in the SELECT statement to calculate the percentage of the total Profit.
Again, why is this important? Well, in case your dashboard has slow performance, you might want to bring certain calculations into Tableau by writing them as table calculations. In some other cases, you might want to push the calculation into the back-end by using simple calculations.
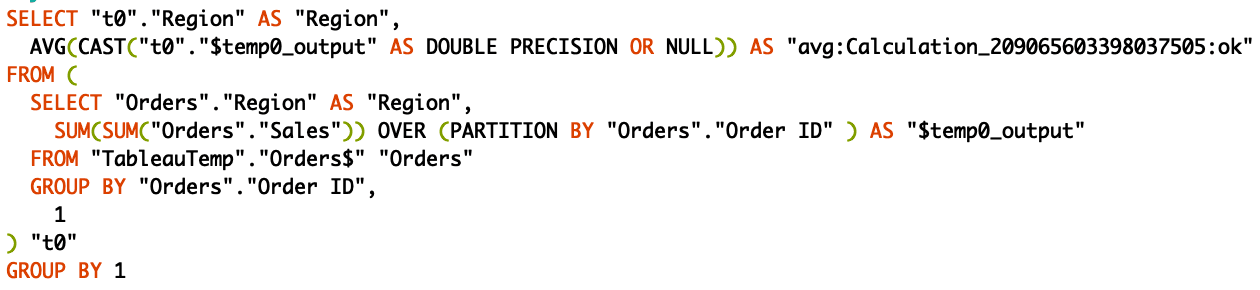
4. Level of Detail Expressions
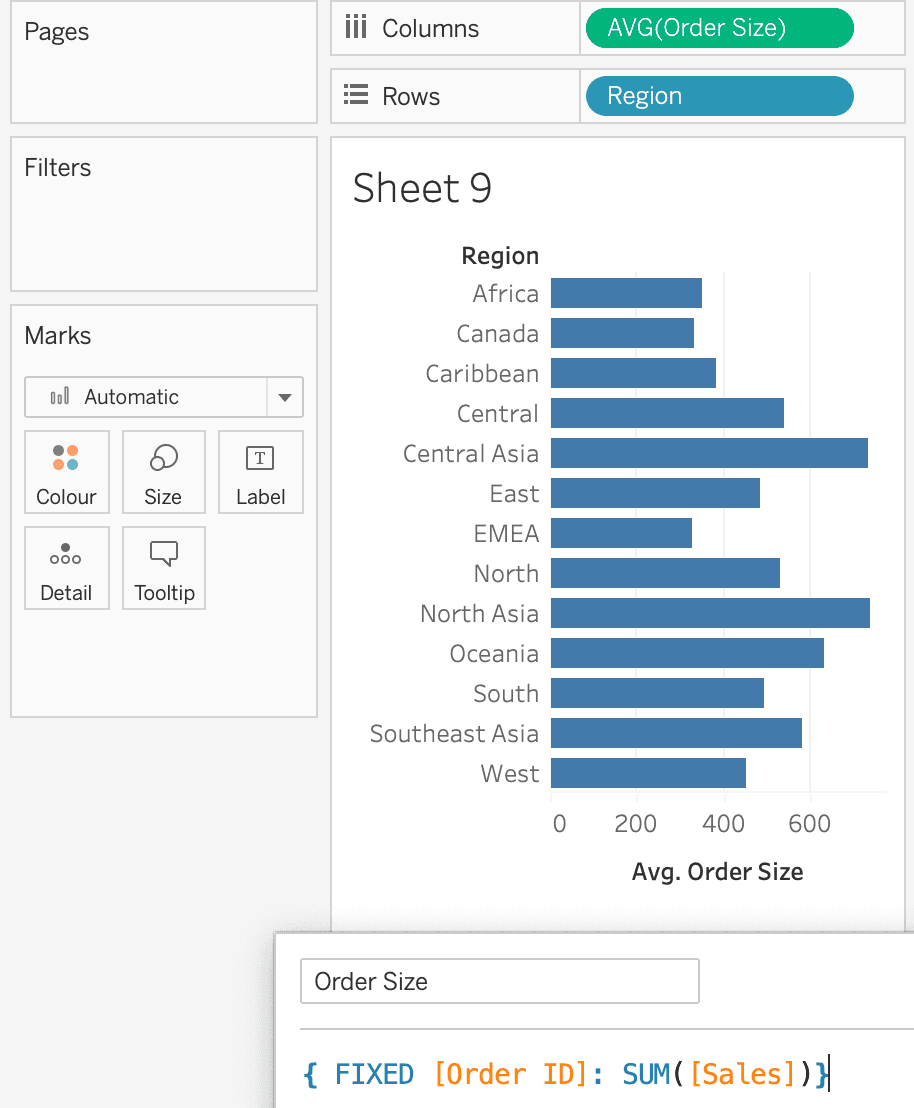
Another example I wanted to show is related to the level of detail expressions (LOD), a very powerful tool in Tableau that allows performing advanced analysis. In my case, I’m simply trying to work out the ‘Average Order Size’ in different ‘Regions’. Looking at the query that was generated in the back-end, we can see that it’s a nested SELECT statement, so we have one SELECT statement which is basically the LOD itself, wrapped around another SELECT statement.
LODs are usually pushed to the back-end database and, in terms of performance, you need to be aware that this will be translated into more advanced and heavy queries. Now that we know this, we might want to pre-calculate the LOD expression in advance in the database so that Tableau won’t need to compute it itself.
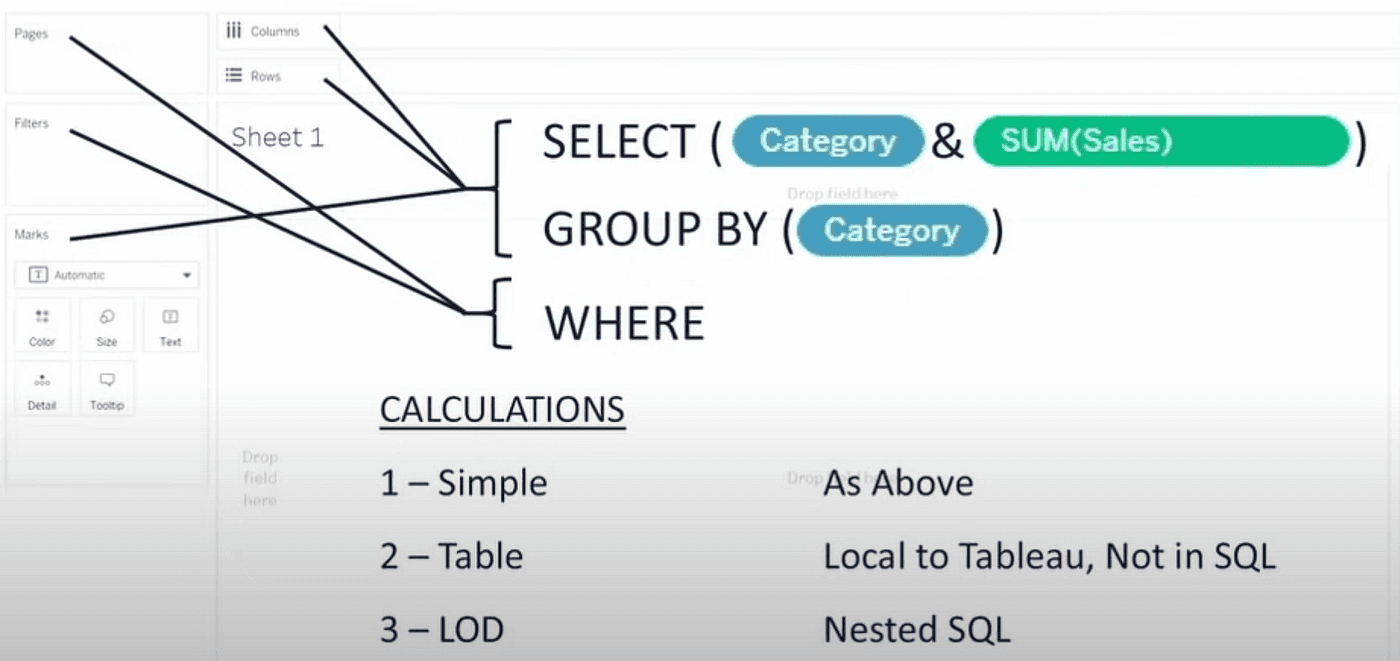
Wrapping it up
In conclusion, the image below should give a summary of how Tableau and its canvas are effectively a SQL interface, which, in my opinion, makes working with data a much better experience compared to writing those queries yourself!
I hope you found something new that will help you get the most out of Tableau! And as always, please do reach out to me with all the suggestions and comments you may have.
Thanks for reading!
