10 Secret Tableau Features You Should Start Using Right Away
Date
May 19, 2021
Category
Tableau Tips

If you are into Visual Analysis you probably might have heard of Tableau, a groundbreaking data visualisation software that is now required for most data analysis and data science roles.
I recently had the chance to work with a senior consultant from Tableau Professional Services and I have to say that this experience really brought my Tableau skills to the next level (given that I’m a Tableau self-learner).
The power of Tableau is its ease of use. With only a few clicks you can drag and drop different data fields to create your view. As per all the other tools, it takes time to explore and master all Tableau features but with this article, I aim to explain 10 tips and tricks which will help you to build compelling dashboards in a timely fashion.
If you prefer the video format of this article, make sure to check it out on my YouTube channel.
1. Extract files from your .twbx Workbook
Did you know that the .twbx extension is actually a kind of compressed and zipped file? And like any compressed doc, you can extract the files within it. This might become very useful in case you want to retrieve the tables that you are using as data sources, icons or any other external file that you embedded in your packaged workbook. In order to do that, just change the extension of your workbook from “.twbx” to “.twbx.zip”. Right-click on the file and click on the Extract option, and you will now see the .twb file, the folders containing your data source files and any other docs that are in the external cache.
2. Connect to a Data Source that is on another Workbook
Did you know that you can get a data source from a different Tableau workbook? Instead of recreating the data source in your existing workbook, you can simply click on Create a new data source on the top bar, go to More, navigate to a specific workbook on your machine and Tableau will list the data sources of that workbook that you can connect to.
3. Quickly Copy and Paste data from Excel
If you need to perform quick analysis or data investigation, you can just copy the cells you are interested in from your Excel spreadsheet, open a Tableau worksheet, simply click File from the top bar and click Paste (you can also use the usual shortcut Ctrl/Command + V) and voilà, your data is ready in a few clicks!
4. Copy and Paste worksheets from one Workbook to another
This is again very simple and can save you tons of time. To do that, right-click on a worksheet and click Copy, go to another workbook, right-click again and Paste. This will actually bring over the worksheet as well as its data source, which again will allow re-using your previous work!
5. Remove a Filter from multiple Worksheets in a few clicks
Imagine that you are working on multiple worksheets and you applied a filter in all of them. Now you want to remove that field as a filter in all the different views. Well, there is a way of doing it without opening each of the worksheets and manually removing the filter. Just go to one of the worksheets and right-click on the filter, select Apply to Worksheets and then All Using This Data Source. This will apply that filter to all the worksheets connected to the same data source. You can then remove the field from the filter panel and the job is done, this will automatically remove the filter to all the other worksheets too!
6. Copy and Paste Worksheet formatting
After you format a worksheet, you can copy its formatting settings and paste them into other worksheets. The settings that you can copy are anything you can set in the Format pane, with the exception of reference lines and annotations. To do that, select the worksheet from which you want to copy the format, right-click the worksheet tab and select Copy Formatting. Now select the worksheet you want to paste the formatting into, right-click the worksheet tab and select Paste Formatting. One extra tip here: if you want to format different worksheets at once, use the Format menu in the top bar, as those settings will apply at the workbook level.
7. Add Visualisations to the Tooltips
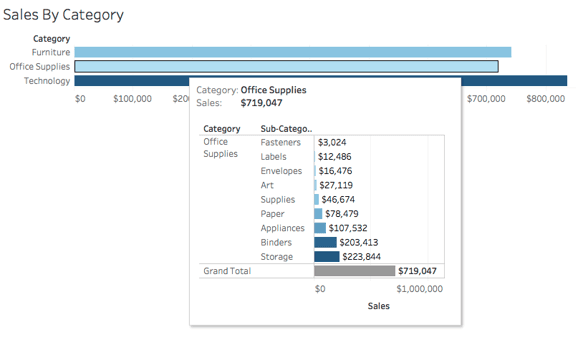
If there is one thing that always surprises users when I showcase a Tableau file is a view that appears on the tooltip of a different worksheet in the dashboard. This is an amazing feature in case you want to display more details about a specific chart, without having to sacrifice space in your dashboard. Just click on Tooltip in the Marks pane, Insert Sheets and then select the worksheet you want to add.
This doesn’t stop here! Tableau will automatically filter the tooltip in line with what you are looking at in your dashboard. For example, in the picture below if you hover over the Office Supplies category, the tooltip will show you sales details specifically about Office Supplies.
8. Use these Shortcuts
There are at least 3 shortcuts that I use all the time and that I would definitely recommend using.
The first one is the Right-Click Drag (Option+Drag for Mac) which allows opening the drop field window, to specify exactly what you want to add to your canvas. Let’s say that you want to add the average for the field Profit in the rows shelf. If you simply add the files into the rows, Tableau will show you the Sum for the field Profit, and you will then need to right-click on the field and select the calculations you want to display. Instead, if you right-click and drag, Tableau will ask you first how you want to display the field, and this is a great time-saver.
The Ctrl + Drag (Command + Drag for Mac) is the shortcut to copy a pill in the canvas and paste it anywhere else. This again will allow you to save tons of time instead of searching for that specific field again, re-create the calculation or re-set the format etc.
The other cool shortcut is related to when you have to build a text table with multiple measures. Instead of adding the field Measure Names into the column shelf, the field Measure Values into the marks pane and then select the ones you are interested in, there is another quick way to do it. Just add your dimension to the column shelf and then double-click all the measures you want to add directly from the fields pane.
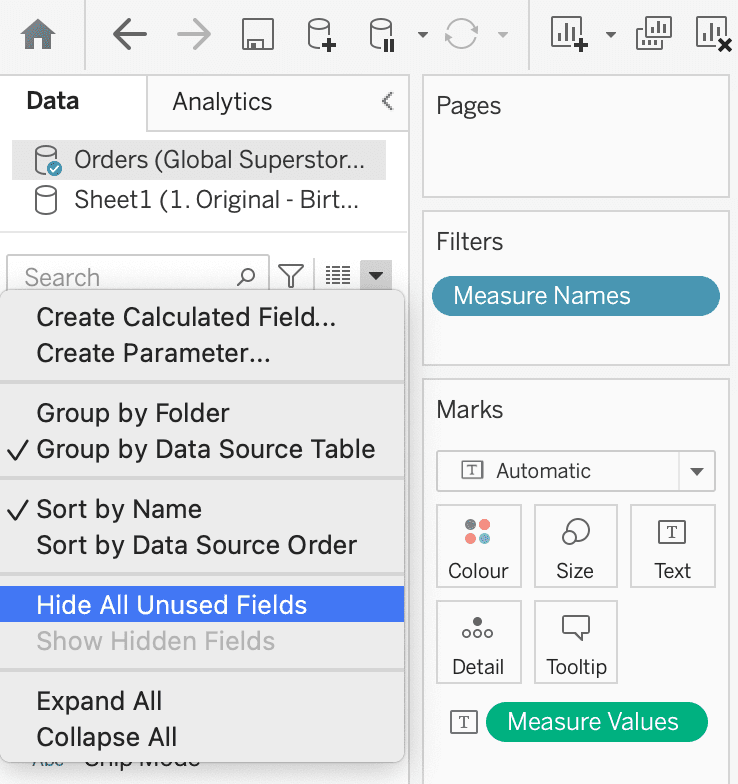
9. Hide all Unused Fields
We rarely have a data connection that has only the data we need. Typically, we end up with data connections that include many columns that are unnecessary for our analysis. There are many things that affect the performance of an extract, but something that can make a huge difference is removing unused columns from the extract. When you are done with your workbook and you are ready to share or publish it, click on the little arrow next to the search bar and make sure Hide All Unused Fields is selected. In this way, Tableau won’t include those fields in the extract, and this can really improve performance!
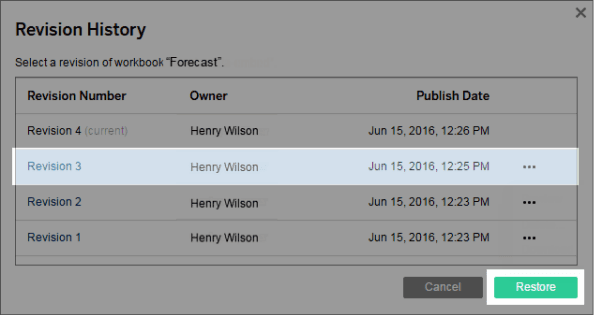
10. Overwrite an existing Workbook when publishing
The last tip is more related to the Tableau Server, and this is something that might make your Tableau experience less stressful. When you are working on different versions of the same workbook, and you are ready to publish an updated file into the Tableau Server I’d always suggest overwriting the existing workbook, by just uploading it into the same folder and using the same title. In this way, if there are issues with the latest version, you can use the Revision History Tableau Server feature to restore the previous version while you correct the latest one. This feature won’t be applicable in case you upload a version using a different name and folder. With that in mind, you can always rely on previous versions and don’t need to create archive folders, backup files or come up with a plan if things go wrong with your last publication.
And there you go! These are my Top 10 Tableau Tips for you. I hope you found something that is new and will help you get the most out of Tableau!
Please do reach out to me with all the suggestions and comments you may have.
Thanks for reading!
If you like this content, make sure to check out my YouTube channel below ****for more!
